
VGT vs QQQ: I Finally Did The Math (Here's The Honest Answer)
2 extracted signals · 0 resolved · 2 still active
 Peter PruIndependent analyst profile
- Source published
- 25 Aug 2026, 19:00 UTC
- Recorded by Tahlil Plus
- 25 Aug 2026, 20:28 UTC
AI-generated source summary
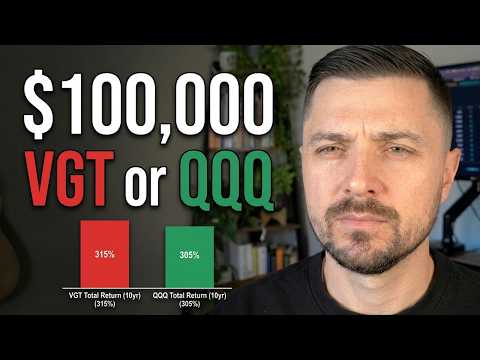
The analysis compares VGT and QQQ, two ETFs. VGT, the Vanguard Information Technology ETF, currently trades at $123.21 with a yield of 0.4% and a 5-year return of 147%. It holds 316 stocks, with a low expense ratio of 0.09%. QQQ, the Invesco QQQ Trust, tracks the Nasdaq 100 and trades around $733.60 with a yield of 0.42% and a 5-year return of just under 20%. QQQ holds 101 securities and has a higher expense ratio of 0.18%. Historically, QQQ's worst drawdown during the dot-com bubble was 82%, while VGT's was 54%, indicating VGT's greater resilience. Over the past 10 years, VGT has outperformed QQQ by 3.5-4 percentage points annually, and over 5 years by 2.3 percentage points. VGT also exhibits a better risk-adjusted return (Sharpe ratio of 1.67 vs 1.42 for QQQ). The key difference lies in their composition: QQQ includes companies like Amazon, Meta, and Alphabet, classified outside the technology sector by GICS, while VGT strictly includes only companies classified as technology. This difference in sector exposure leads to VGT's higher performance and lower volatility, making it the preferred choice for pure tech exposure. QQQ offers broader exposure to the Nasdaq 100, including major non-tech companies, which might be appealing for diversification, but VGT's metrics suggest a stronger performance profile for a concentrated tech focus.
AI-generated summary based on the source content.
Signal outcomes at a glance
Tracking LiveSignals in this source


Evidence and evaluation progress
- Original source published
The analyst published the original source item.
- Source recorded by Tahlil Plus
The public source was preserved as the evidence record for this case.
- Market predictions extracted
2 eligible signals linked to this case.
- Outcome tracking started
Tahlil Plus began monitoring the extracted predictions.
- Source processing completed
Source analysis and structured extraction completed.
- Live evaluation in progress
2 signals remain active.
Peter Pru
Platform-wide history, separate from this source evaluation.
Tahlil Plus independently records and evaluates public market predictions. Extraction may be AI-assisted and results follow the Tahlil Plus methodology. This information is not financial advice.