
SCHD vs. NOBL: Which $1M Dividend Portfolio Wins?
1 extracted signal · 0 resolved · 1 still active
 Peter PruIndependent analyst profile
- Source published
- 12 Sept 2026, 19:00 UTC
- Recorded by Tahlil Plus
- 12 Sept 2026, 23:03 UTC
AI-generated source summary
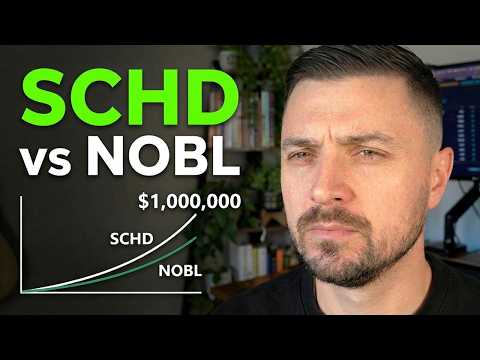
The video compares two dividend-focused ETFs, SCHD and NOBL, focusing on their income generation and long-term performance. SCHD, with a current yield of 2.99% and a 0.06% expense ratio, shows a dividend growth rate of 8.19%. A $1 million investment in SCHD is estimated to yield approximately $750 per month, with an annual fee cost of $600, and a projected 2026 return of +16 points, outperforming NOBL by 16 percentage points. NOBL, with a lower yield of just over 2% and a higher expense ratio of 0.35%, has a higher annual dividend per share ($1.21 vs. $1.05). A $1 million investment in NOBL yields roughly $1700 per month, with annual fees of $3500. Its equal weighting and 30% sector cap provide defensive characteristics, protecting against concentration risk and offering shallower drawdowns in bear cycles, though it has lagged in growth-led markets, being excluded from recent leadership. The analysis highlights that while SCHD provides higher immediate income and outperformance on a million-dollar investment, NOBL's structure offers defensive benefits. The question is posed whether NOBL's income sacrifice is worth its defensive features.
AI-generated summary based on the source content.
Signal outcomes at a glance
Tracking LiveSignals in this source
Evidence and evaluation progress
- Original source published
The analyst published the original source item.
- Source recorded by Tahlil Plus
The public source was preserved as the evidence record for this case.
- Market predictions extracted
1 eligible signal linked to this case.
- Source processing completed
Source analysis and structured extraction completed.
- Live evaluation in progress
1 signal remains active.
Peter Pru
Platform-wide history, separate from this source evaluation.
Tahlil Plus independently records and evaluates public market predictions. Extraction may be AI-assisted and results follow the Tahlil Plus methodology. This information is not financial advice.