
SoFi Just Surged 20%… Is $60 Next?
1 extracted signal · 0 resolved · 1 still active
 The Long InvestorIndependent analyst profile
- Source published
- 03 Nov 2026, 17:09 UTC
- Recorded by Tahlil Plus
- 03 Nov 2026, 17:10 UTC
AI-generated source summary
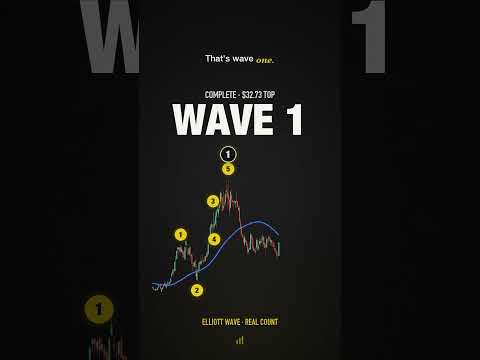
The analysis focuses on SoFi (SOFI) using Elliott Wave theory. The stock has completed a five-wave impulse move (Wave 1) from its 2024 low, reaching a top around $32.73. Since then, it has been in a correction phase (Wave 2) for approximately seven months, trading sideways between the 0.5 and 0.618 Fibonacci retracement levels. The current price is estimated around $23.00. The analysis highlights a bounce off the 0.618 Fibonacci level near $15.08, marking the end of Wave 2. The immediate next step for a bullish continuation is to reclaim the 50-week moving average, which is projected to be around $24.92. If SOFI moves above $25, it signals the start of the bull case (Wave 3). Conversely, if the price fails at $15, it would fall to the 200-week moving average, estimated near $13.14, serving as the next support level. However, the primary bullish outlook suggests that if Wave 3 plays out as expected, the target price is $60.70.
AI-generated summary based on the source content.
Signal outcomes at a glance
Tracking LiveSignals in this source

Evidence and evaluation progress
- Original source published
The analyst published the original source item.
- Source recorded by Tahlil Plus
The public source was preserved as the evidence record for this case.
- Market predictions extracted
1 eligible signal linked to this case.
- Source processing completed
Source analysis and structured extraction completed.
- Outcome tracking started
Tahlil Plus began monitoring the extracted predictions.
- Live evaluation in progress
1 signal remains active.
The Long Investor
Platform-wide history, separate from this source evaluation.
Tahlil Plus independently records and evaluates public market predictions. Extraction may be AI-assisted and results follow the Tahlil Plus methodology. This information is not financial advice.