
XRP IS LOOKING INSANE RIGHT NOW (WATCH THIS LEVEL)
1 extracted signal · 0 resolved · 1 still active
 CoinForgeIndependent analyst profile
- Source published
- 31 Oct 2026, 23:45 UTC
- Recorded by Tahlil Plus
- 01 Nov 2026, 01:31 UTC
AI-generated source summary
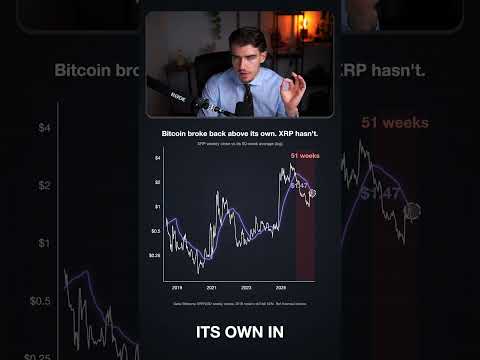
The analysis focuses on XRP's weekly price action relative to its 50-week moving average. XRP has been below this average for 51 consecutive weeks, a significant period. Historically, after such prolonged periods below the 50-week moving average, XRP has seen substantial rallies. For instance, in August 2020, after 51 weeks below the average, XRP rallied 152% in a year. Similarly, in March 2023, after a prolonged period below, it rallied 41% in a year. The key resistance level to watch is identified as $1.47, which is the current 50-week moving average. The current price is $1.27. A reclaim and sustained hold above $1.47 is seen as a bullish signal, potentially leading to further upside. Conversely, failure to break above $1.47 and a drop below the current support levels, around $0.90, would invalidate the bullish thesis and suggest continued bearishness.
AI-generated summary based on the source content.
Signal outcomes at a glance
Tracking LiveSignals in this source

Evidence and evaluation progress
- Original source published
The analyst published the original source item.
- Source recorded by Tahlil Plus
The public source was preserved as the evidence record for this case.
- Market predictions extracted
1 eligible signal linked to this case.
- Outcome tracking started
Tahlil Plus began monitoring the extracted predictions.
- Source processing completed
Source analysis and structured extraction completed.
- Live evaluation in progress
1 signal remains active.
CoinForge
Platform-wide history, separate from this source evaluation.
Tahlil Plus independently records and evaluates public market predictions. Extraction may be AI-assisted and results follow the Tahlil Plus methodology. This information is not financial advice.