
Elliott Wave View: GBPUSD Eyeing a Three Wave Zigzag Rally Before Resuming the Downtrend
1 extracted signal · 0 resolved · 1 still active
 Elliott Wave ForecastIndependent analyst profile
- Source published
- 30 Oct 2026, 02:04 UTC
- Recorded by Tahlil Plus
- 30 Oct 2026, 04:43 UTC
AI-generated source summary
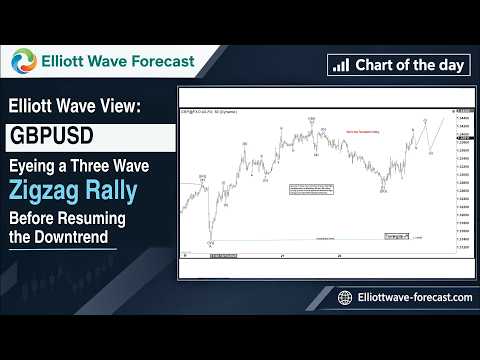
The analysis focuses on the GBPUSD pair, utilizing Elliott Wave theory on a 1-hour timeframe. The current price is observed at 1.33555, with a projected bullish trend. The target price is set at 1.34500, indicating an expected upward movement. A failure bound is established at 1.32500, below which the bullish thesis would be invalidated. The analyst interprets the recent price action as part of a larger corrective pattern, potentially a double zigzag or a truncated 7-wave sequence, suggesting a short-term bullish continuation towards the target before a potential reversal. The longer-term daily chart analysis indicates that the current upward move on the hourly chart is likely a counter-trend rally within a larger bearish structure, possibly completing a 'B' wave at around 1.36800, followed by a decline to new lows below 1.30000.
AI-generated summary based on the source content.
Signal outcomes at a glance
Tracking LiveSignals in this source

Evidence and evaluation progress
- Original source published
The analyst published the original source item.
- Source recorded by Tahlil Plus
The public source was preserved as the evidence record for this case.
- Market predictions extracted
1 eligible signal linked to this case.
- Outcome tracking started
Tahlil Plus began monitoring the extracted predictions.
- Source processing completed
Source analysis and structured extraction completed.
- Live evaluation in progress
1 signal remains active.
Elliott Wave Forecast
Platform-wide history, separate from this source evaluation.
Tahlil Plus independently records and evaluates public market predictions. Extraction may be AI-assisted and results follow the Tahlil Plus methodology. This information is not financial advice.