
THIS CHART SAYS CRYPTO BULL RUN!! 📈 OCTOBER 21
2 extracted signals · 0 resolved · 2 still active
 Overkill TradingIndependent analyst profile
- Source published
- 21 Oct 2026, 22:53 UTC
- Recorded by Tahlil Plus
- 22 Oct 2026, 01:34 UTC
AI-generated source summary
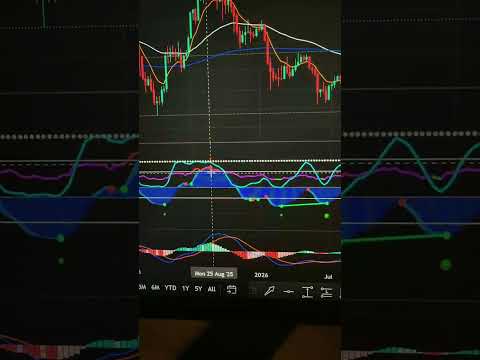
The analysis focuses on USDC.D (USDC Dominance) as a leading indicator for the overall crypto market trend. The presenter posits that when USDC.D rises, it signifies money flowing out of major cryptocurrencies like Bitcoin and Ethereum into stablecoins, indicating a bear market. Conversely, when USDC.D falls, money is flowing back into riskier assets, signaling a bull market. The chart for USDC.D is analyzed on a weekly timeframe. Historically, significant uptrends in USDC.D have preceded bear markets in crypto, and downtrends have coincided with or preceded bull runs. The current trend of USDC.D is observed to be moving downwards, with a recent green dot suggesting a potential bottoming out and a subsequent reversal. This is interpreted as a bullish signal for the broader crypto market. ETHUSD is presented as an example of a cryptocurrency that has historically performed well when USDC.D declines. The chart for ETHUSD shows a previous downtrend from August 2025 to March 2026, during which USDC.D was rising. The recent decline in USDC.D suggests a potential reversal and uptrend for ETHUSD. The presenter expresses a bullish outlook for ETHUSD, anticipating a significant price increase. The analysis relies on historical patterns and indicator signals on weekly charts to predict future market movements.
AI-generated summary based on the source content.
Signal outcomes at a glance
Tracking LiveSignals in this source


Evidence and evaluation progress
- Original source published
The analyst published the original source item.
- Source recorded by Tahlil Plus
The public source was preserved as the evidence record for this case.
- Market predictions extracted
2 eligible signals linked to this case.
- Source processing completed
Source analysis and structured extraction completed.
- Outcome tracking started
Tahlil Plus began monitoring the extracted predictions.
- Live evaluation in progress
2 signals remain active.
Overkill Trading
Platform-wide history, separate from this source evaluation.
Tahlil Plus independently records and evaluates public market predictions. Extraction may be AI-assisted and results follow the Tahlil Plus methodology. This information is not financial advice.