
Technical Analysis of Stocks: SPY / QQQ / NVDA / TSLA / AMD / PLTR / MU / SNDK
5 extracted signals · 5 resolved · 0 still active
 The Finance HydraIndependent analyst profile
- Source published
- 20 Oct 2026, 21:30 UTC
- Recorded by Tahlil Plus
- 21 Oct 2026, 03:05 UTC
AI-generated source summary
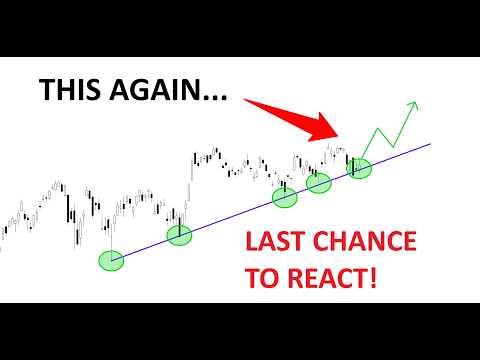
The analysis focuses on the SPY, QQQ, NVDA, AMD, and MU. SPY is analyzed on daily, hourly, and weekly charts, showing a bullish reaction above support, with a target of 779.96 and a fail bound at 762.08. QQQ is exhibiting an inverted head and shoulders pattern on the hourly and daily charts, suggesting a potential bullish reversal. The failure point is considered around 708.38, with a target potentially reaching 750.0. NVDA is analyzed on daily and hourly charts, showing a bullish engulfing pattern above support, indicating a potential continuation of the uptrend towards 229.98, with failure below 211.53. AMD on daily charts shows a potential bottom signal near 530.0, with a target of 561.49. On the weekly chart, AMD is identified as bullish, retesting its 21-week MA. MU is showing a bearish trend on the daily chart, with a potential target of $1000 and a failure point at 879.96. On the weekly chart, MU is considered bearish, with significant price decline and a bearish head and shoulders pattern on the hourly chart, indicating potential further downside. The overall market sentiment for SPY, QQQ, NVDA, and AMD is bullish on short to medium terms, despite some short-term bearish signals on QQQ and MU.
AI-generated summary based on the source content.
Signal outcomes at a glance
Evaluation CompleteSignals in this source




Evidence and evaluation progress
- Original source published
The analyst published the original source item.
- Source recorded by Tahlil Plus
The public source was preserved as the evidence record for this case.
- Market predictions extracted
5 eligible signals linked to this case.
- Outcome tracking started
Tahlil Plus began monitoring the extracted predictions.
- Source processing completed
Source analysis and structured extraction completed.
- First prediction resolved
The first evaluable outcome in this case reached a terminal result.
- Case evaluation completed
All evaluable predictions in this case reached terminal outcomes.
The Finance Hydra
Platform-wide history, separate from this source evaluation.
Tahlil Plus independently records and evaluates public market predictions. Extraction may be AI-assisted and results follow the Tahlil Plus methodology. This information is not financial advice.