
NVDA Cycle & Chart Analysis - Is the Run Losing Steam?
1 extracted signal · 0 resolved · 1 still active
 Steve MillerIndependent analyst profile
- Source published
- 18 Oct 2026, 19:00 UTC
- Recorded by Tahlil Plus
- 19 Oct 2026, 00:09 UTC
AI-generated source summary
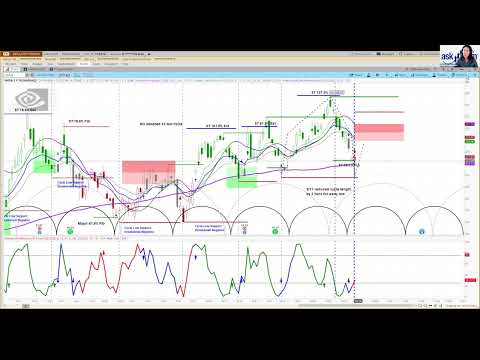
The analysis focuses on NVIDIA (NVDA) using daily and weekly cycle analysis. The weekly cycle is identified as being in a 'negative' phase, expected to bottom out in late November. The current price is around 217.06. The analysis suggests that the recent upward movement has failed to break significant resistance levels, specifically the 78.6% Fibonacci retracement at approximately 217.61. The failure to overcome this level, coupled with a breakdown below the short-term 78.6% Fibonacci level yesterday, indicates a bearish outlook. The target price is set at the 78.6% Fibonacci level of 215.50. A daily close above 218.75 would invalidate this bearish short-term outlook. The current trend is considered bearish, with expectations of further downside or consolidation in the short term before the next potential cycle low.
AI-generated summary based on the source content.
Signal outcomes at a glance
Tracking LiveSignals in this source

Evidence and evaluation progress
- Original source published
The analyst published the original source item.
- Source recorded by Tahlil Plus
The public source was preserved as the evidence record for this case.
- Market predictions extracted
1 eligible signal linked to this case.
- Source processing completed
Source analysis and structured extraction completed.
- Outcome tracking started
Tahlil Plus began monitoring the extracted predictions.
- Live evaluation in progress
1 signal remains active.
Steve Miller
Platform-wide history, separate from this source evaluation.
Tahlil Plus independently records and evaluates public market predictions. Extraction may be AI-assisted and results follow the Tahlil Plus methodology. This information is not financial advice.