
Bitcoin dumpt. What's next?
1 extracted signal · 1 resolved · 0 still active
 de Bitcoin ConsultantIndependent analyst profile
- Source published
- 23 Sept 2026, 15:00 UTC
- Recorded by Tahlil Plus
- 23 Sept 2026, 17:21 UTC
AI-generated source summary
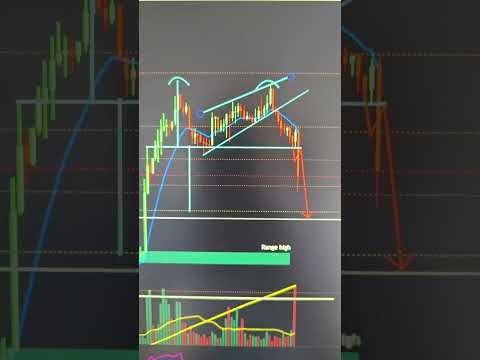
The analysis highlights a double top pattern formation followed by a rising wedge breakdown on the 4-hour chart for BTCUSDT. The price has breached the neckline of the double top and broken below the rising wedge, indicating a bearish sentiment. The target price is set at the 1 (80,333.16) Fibonacci level, which represents a significant support zone. The invalidation level for this bearish prediction is set above the 0.382 Fibonacci level (84,877.02), as a move above this point would negate the bearish thesis. Volume analysis also supports the bearish momentum, with increased volume accompanying the price decline. The analyst is anticipating a continuation of the downward movement towards the specified target.
AI-generated summary based on the source content.
Signal outcomes at a glance
Evaluation CompleteSignals in this source

Evidence and evaluation progress
- Original source published
The analyst published the original source item.
- Source recorded by Tahlil Plus
The public source was preserved as the evidence record for this case.
- Market predictions extracted
1 eligible signal linked to this case.
- Outcome tracking started
Tahlil Plus began monitoring the extracted predictions.
- Source processing completed
Source analysis and structured extraction completed.
- First prediction resolved
The first evaluable outcome in this case reached a terminal result.
- Case evaluation completed
All evaluable predictions in this case reached terminal outcomes.
de Bitcoin Consultant
Platform-wide history, separate from this source evaluation.
Tahlil Plus independently records and evaluates public market predictions. Extraction may be AI-assisted and results follow the Tahlil Plus methodology. This information is not financial advice.