
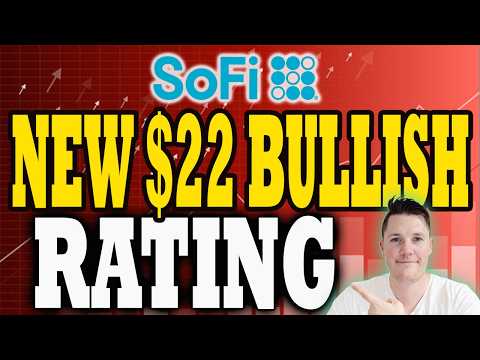
NEW SoFi $22 Bullish Rating 🔥 BIG Money Quietly Bought the Dip │ SoFI Stock Analysis
1 extracted signal · 1 resolved · 0 still active
 Trending StocksIndependent analyst profile
- Source published
- 09 Sept 2026, 01:59 UTC
- Recorded by Tahlil Plus
- 10 Sept 2026, 16:37 UTC
AI-generated source summary
The video discusses SOFI Technologies, with the current price at $18.01, showing a slight decrease of -0.21%. The analysis indicates a bullish outlook with a target price of $22.00. The fail bound, or the price at which the bullish thesis would be invalidated, is set at $17.00. This suggests that as long as SOFI stays above $17.00, the upward momentum is expected to continue towards the $22.00 target. The analysis also touches on broader market sentiment, including concerns about interest rate hikes and geopolitical tensions, but SOFI's performance is viewed in isolation from these broader factors due to its stock-specific price action and analyst ratings. Despite a general market hesitancy, the stock has shown resilience, trading above its 50-day moving average, which is currently at $17.88. This support level is crucial for maintaining the bullish trend. Furthermore, institutional buying activity and a significant number of open interest in call options suggest a positive sentiment among larger market participants. However, the video also highlights the significant amount of short positions that have been returning, indicating that some traders are betting against the stock. The cost to borrow is noted as -0.13%, which is a very low annual rate, suggesting that shorting SOFI is not prohibitively expensive for those looking to do so. The technical indicators, such as the Stochastic RSI, are neutral, indicating neither an overbought nor oversold condition, which could support further price discovery.
AI-generated summary based on the source content.
Signal outcomes at a glance
Evaluation CompleteSignals in this source

Evidence and evaluation progress
- Original source published
The analyst published the original source item.
- Source recorded by Tahlil Plus
The public source was preserved as the evidence record for this case.
- Market predictions extracted
1 eligible signal linked to this case.
- Source processing completed
Source analysis and structured extraction completed.
- Outcome tracking started
Tahlil Plus began monitoring the extracted predictions.
- First prediction resolved
The first evaluable outcome in this case reached a terminal result.
- Case evaluation completed
All evaluable predictions in this case reached terminal outcomes.
Trending Stocks
Platform-wide history, separate from this source evaluation.
Tahlil Plus independently records and evaluates public market predictions. Extraction may be AI-assisted and results follow the Tahlil Plus methodology. This information is not financial advice.