
Why Bitcoin Compounding Looks Wrong on Paper
1 extracted signal · 0 resolved · 1 still active
 On-Chain Mind01 May 2026, 16:05 UTC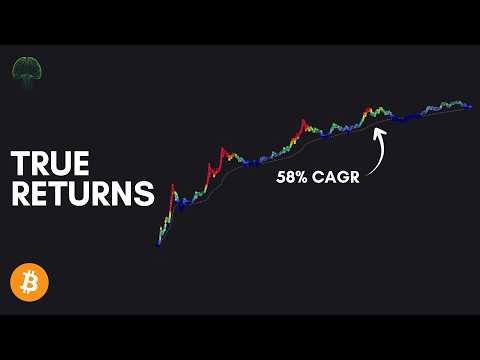
AI-generated source summary
The video discusses the concept of compound annual growth rate (CAGR) as a metric for evaluating asset performance over time. It highlights that while standard CAGR calculations can be misleading due to cherry-picking start and end points, the 200-week moving average provides a more stable indicator of an asset's underlying growth trend. For Bitcoin, the 200-week CAGR is approximately 70% over the past decade, and for the S&P 500, it's around 17-18%. For TQQQ, a leveraged ETF, the 200-week CAGR is estimated at 40-50%. The analysis emphasizes that these figures are derived from the underlying growth trend of the asset itself, not just isolated data points. It cautions against relying solely on simple CAGR figures, especially for volatile assets, and suggests scaling investment aggression based on the asset's price relative to its 200-week moving average. The principle is to be more aggressive when the asset is cheap relative to its trend and less aggressive when it's expensive.
AI-generated summary based on the source content.
Evidence and evaluation progress
- Original source published
The analyst published the original source item.
- Source recorded by Tahlil Plus
The public source was preserved as the evidence record for this case.
- Market predictions extracted
1 eligible signal linked to this case.
- Source processing completed
Source analysis and structured extraction completed.
- Outcome tracking started
Tahlil Plus began monitoring the extracted predictions.
- Live evaluation in progress
1 signal remains active.
Signals in this source

More Prediction Case Files from On-Chain Mind
The Real Reason Bitcoin Keeps Bleeding
This Only Happens Near Bitcoin Bottoms
Bitcoin Just Hit Its Most Reliable Bottom Signal
How Long Does Bitcoin Take to Recover?
The EXACT Price Bitcoin’s Bull Market Returns
Bitcoin Is Running Out of Sellers
On-Chain Mind
Tahlil Plus independently records and evaluates public market predictions. Extraction may be AI-assisted and results follow the Tahlil Plus methodology. This information is not financial advice.