
After GOLD Sunday analysis 12/29/2024
1 extracted signal · 1 resolved · 0 still active
 The Trading Routine30 Dec 2024, 14:13 UTC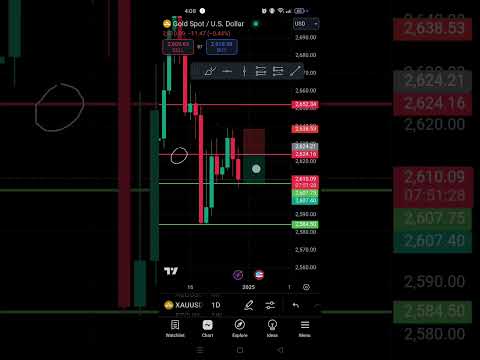
AI-generated source summary
The analysis focuses on XAUUSD, which has retested a resistance level around 2624.16. A short trade was initiated with an entry price around 2609.68, targeting a support level at 2584.50. The stop loss is set above the resistance at 2638.53. The current market trend is observed as bearish, and the predicted trend aligns with this bearish outlook, aiming for a downside move towards the target support level. The trade setup indicates a risk-reward ratio of approximately 1:1.17, suggesting a calculated approach to manage potential losses while seeking profit. The analysis highlights the importance of discipline in maximizing profits and adhering to the trade plan.
AI-generated summary based on the source content.
Evidence and evaluation progress
- Original source published
The analyst published the original source item.
- Source recorded by Tahlil Plus
The public source was preserved as the evidence record for this case.
- Market predictions extracted
1 eligible signal linked to this case.
- Source processing completed
Source analysis and structured extraction completed.
- Outcome tracking started
Tahlil Plus began monitoring the extracted predictions.
- First prediction resolved
The first evaluable outcome in this case reached a terminal result.
- Case evaluation completed
All evaluable predictions in this case reached terminal outcomes.
Signals in this source

More Prediction Case Files from The Trading Routine
Today is the 2nd—welcome to today's analysis! Currently, gold is ranging between the support level at 3,324 and the resistance level at 3,350 on the hourly chart. If gold breaks below the support at 3,324, we may see a retest to the next support at 3,304. Otherwise, if gold breaks above the resistance at 3,350, we may see a retest to the next resistance at 3,365.
Today is the 25th—welcome to today's analysis! Currently, gold is ranging between the support level at 3,316 and the resistance level at 3,334 on the hourly chart. If gold breaks below the support at 3,316, we may see a retest to the next support at 3,300. Otherwise, if gold breaks above the resistance at 3,334 , we may see a retest to the next resistance at 3,351.
The Trading Routine
Tahlil Plus independently records and evaluates public market predictions. Extraction may be AI-assisted and results follow the Tahlil Plus methodology. This information is not financial advice.