
CPI Cooled, Financials Dominated, MAGS Are Rotating Back — Here's What the Charts Are Saying Now
1 extracted signal · 1 resolved · 0 still active
 TRADING APOLOGISTIndependent analyst profile
- Source published
- 15 Jul 2026, 06:30 UTC
- Recorded by Tahlil Plus
- 30 Jul 2026, 03:54 UTC
AI-generated source summary
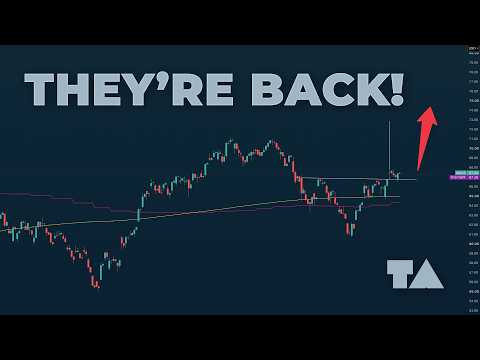
The analysis covers major indices and sectors, highlighting mixed performance. The S&P 500 (SPX) and Nasdaq 100 (NDX) are showing bullish continuation, with targets at 4500 and 15000 respectively, supported by ongoing uptrends. The Invesco S&P 500 Equal Weight ETF (RSP) is also trending upwards, targeting 212. However, semiconductors (SMH) and Bitcoin (BTCUSD) are showing signs of weakness or consolidation. SMH broke down from a pattern and is bearish, with a potential target of 250, failing below 250. Bitcoin is attempting to hold support at 39000 after a recent pullback, with potential for a bounce, but the chart structure suggests a bearish bias below 42000. The analyst also noted the strength in Energy (XLE) and weakness in Materials (XME) and Semiconductors (SOX), with Bitcoin potentially forming an inverse head and shoulders pattern. The 1-hour and 4-hour charts for ANET suggest potential upside, while the weekly chart for PLTR shows a bearish trend. The overall market sentiment is mixed, with tech sectors showing strength while other areas are under pressure. The analyst suggests caution for IBM and interest in a potential breakout for ANET.
AI-generated summary based on the source content.
Signal outcomes at a glance
Evaluation CompleteSignals in this source

Evidence and evaluation progress
- Original source published
The analyst published the original source item.
- Source recorded by Tahlil Plus
The public source was preserved as the evidence record for this case.
- Market predictions extracted
1 eligible signal linked to this case.
- Source processing completed
Source analysis and structured extraction completed.
- Outcome tracking started
Tahlil Plus began monitoring the extracted predictions.
- First prediction resolved
The first evaluable outcome in this case reached a terminal result.
- Case evaluation completed
All evaluable predictions in this case reached terminal outcomes.
TRADING APOLOGIST
Platform-wide history, separate from this source evaluation.
Tahlil Plus independently records and evaluates public market predictions. Extraction may be AI-assisted and results follow the Tahlil Plus methodology. This information is not financial advice.