
Youtube market analysis
1 extracted signal · 1 resolved · 0 still active
 EFMS TRADE17 Feb 2026, 13:45 UTC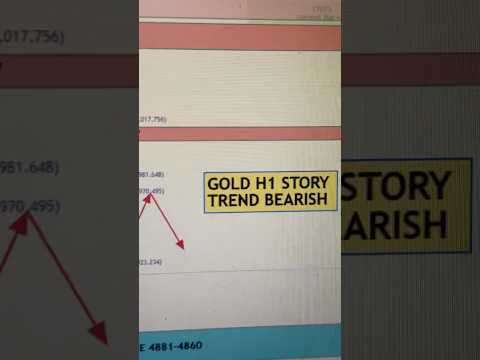
AI-generated source summary
The H1 chart for Gold (XAUUSD) indicates a bearish trend. The price has broken below a demand zone, and the analysis suggests a potential upward retracement to the 61.80% Fibonacci level at 4981.648 before continuing its downward movement towards lower demand zones. The immediate target for a potential bullish move is resistance around 4981.648, with invalidation if the price falls below 4970.495.
AI-generated summary based on the source content.
Evidence and evaluation progress
- Original source published
The analyst published the original source item.
- Source recorded by Tahlil Plus
The public source was preserved as the evidence record for this case.
- Market predictions extracted
1 eligible signal linked to this case.
- Outcome tracking started
Tahlil Plus began monitoring the extracted predictions.
- First prediction resolved
The first evaluable outcome in this case reached a terminal result.
- Case evaluation completed
All evaluable predictions in this case reached terminal outcomes.
Signals in this source

More Prediction Case Files from EFMS TRADE
What's next for Gold? Quick video
GOLD MARKET OUTLOOK |30 JULY 2026 | XAUUSD FORCAST BY EFMS TRADE
GOLD MARKET OUTLOOK | 29 JULY 2026 | XAUUSD FORCAST BY EFMS TRADE
GOLD MARKET OUTLOOK | 28 JULY 2026 | XAUUSD FORCAST BY EFMS TRADE
Gold range bound: what to do next? Must watch! Quick
GOLD MARKET OUTLOOK | JULY 27, 2026 | XAUUSD FORECAST BY EFMS TRADE
EFMS TRADE
Tahlil Plus independently records and evaluates public market predictions. Extraction may be AI-assisted and results follow the Tahlil Plus methodology. This information is not financial advice.