
Welcome to Czar Gets Crypto! Please note the following:
1 extracted signal · 1 resolved · 0 still active
 C-Zar Gets Crypto 07 Jan 2026, 20:21 UTC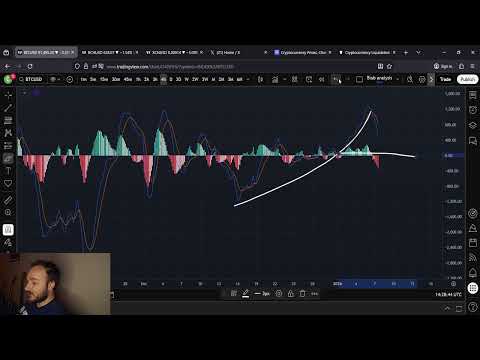
AI-generated source summary
The analysis focuses on Bitcoin's price action on daily, 4-hour, and 1-hour timeframes. Currently, Bitcoin is trading around $91,500. On the daily chart, price action shows a recent large bearish candle, effectively engulfing prior bullish movement. However, the broader context remains within a larger consolidation range, approximately between $87,000 and $94,000, from which an upside breakout is anticipated. The analyst identifies potential support at the 0.5 and 0.618 Fibonacci retracement levels, specifically around $90,667 to $89,736, following a recent price pump. Indicators on the 1-hour chart (RSI, Stochastics, MACD) are showing bearish momentum, suggesting further short-term downside, but the 4-hour RSI demonstrates an overall bullish trendline from early December, indicating underlying strength. Stochastics on the 4-hour chart have reset from overbought conditions, allowing for a potential quick reaction upwards. The MACD on the 4-hour chart shows increasing bearish momentum, but this is viewed in the context of hidden bullish divergence (lower lows in indicator with higher lows in price), suggesting weakening bearish pressure. The analyst expects continued consolidation in the $87,000-$94,000 range for another five to six days, possibly until the 15th-20th of January, before a breakout to the upside. The target for this breakout is projected to surpass the significant resistance zone around $100,000-$101,000, potentially reaching $105,000 initially, and then possibly $115,000-$120,000 after a retest. A sustained break below the $89,000 support would invalidate this bullish outlook.
AI-generated summary based on the source content.
Evidence and evaluation progress
- Original source published
The analyst published the original source item.
- Source recorded by Tahlil Plus
The public source was preserved as the evidence record for this case.
- Market predictions extracted
1 eligible signal linked to this case.
- Outcome tracking started
Tahlil Plus began monitoring the extracted predictions.
- First prediction resolved
The first evaluable outcome in this case reached a terminal result.
- Case evaluation completed
All evaluable predictions in this case reached terminal outcomes.
Signals in this source

More Prediction Case Files from C-Zar Gets Crypto
Bitcoin BTC Price Prediction: 31st of July
BCH Bitcoin Cash Price Prediction: 30th of July
BTC Bitcoin Price Prediction: 30th of July (Standard Volatility)
KTA Keeta Price Prediction: TIME TO BUY?!?!?!
XRP Price Prediction: 29th of July
Bitcoin BTC Price Prediction: 29th of July FOMC Meeting Today
C-Zar Gets Crypto
Tahlil Plus independently records and evaluates public market predictions. Extraction may be AI-assisted and results follow the Tahlil Plus methodology. This information is not financial advice.