
Weekly Gold Analysis Starting 05th Jan to 09th Jan | New Year Market Forecast | Silver & Oil Update | 1st Analysis of Year 2026
3 extracted signals · 3 resolved · 0 still active
 Mohammad Arafat03 Jan 2026, 14:29 UTC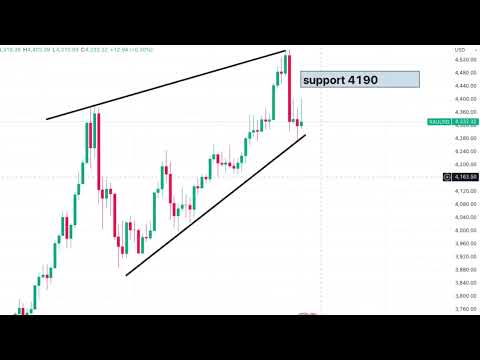
AI-generated source summary
The weekly market analysis began by noting Gold's start to the week around $4533, followed by a significant drop of approximately $250 on the 29th, hitting almost all-time highs before correcting. This move represented the largest single-day red candle in two and a half months since October 21st, attributed to year-end profit booking. The price reached lows around $4274 by December 31st. For the upcoming week, Gold has a support level at $4190 and a resistance at $4555. The trend is currently considered positive, implying a potential movement towards the resistance if the support holds. Silver experienced extreme volatility, opening around $80, reaching a high of $83.40, and a low of $70.50 within a single day. This rapid $15-20 movement in one session, along with a margin increase by COMEX, led to significant liquidations. Silver’s psychological support is at $68, with a closing below this level potentially leading to drops towards $65 or $62. The resistance is at $80. The trend for Silver remains positive, despite the recent 10-15% correction. Crude Oil made lows around $55 and highs around $59. For a positive return, Crude Oil needs a decisive closing above $61. Currently, its support is at $54.50, and the resistance is $61. The trend for Crude Oil is assessed as weak.
AI-generated summary based on the source content.
Evidence and evaluation progress
- Original source published
The analyst published the original source item.
- First prediction resolved
The first evaluable outcome in this case reached a terminal result.
- Case evaluation completed
All evaluable predictions in this case reached terminal outcomes.
- Source recorded by Tahlil Plus
The public source was preserved as the evidence record for this case.
- Market predictions extracted
3 eligible signals linked to this case.
- Outcome tracking started
Tahlil Plus began monitoring the extracted predictions.
Signals in this source



More Prediction Case Files from Mohammad Arafat
Weekly Gold Analysis & Strategy From 27 July to 31 July | Crude Oil Prediction Next Week
More Crash in GOLD | XAUUSD Trading Strategy for 24 July | Crude Oil Strategy | XAGUSD Levels
GOLD CRASH Coming ? Gold Analysis Intra Day Today | XAUUSD Strategy 23 July | Crude Oil Resistance
GOLD Trend Reversal | XAUUSD Strategy for Today 22nd July | Gold Price Forecast | Crude Oil Update
Heavy Strikes on Iran | Gold Levels Monday | Key Market Zones This Week | Oil at a Turning Point?
Gold Crash or $4200? The Next Big Move | Gold's Make-or-Break Moment | New XAUUSD Levels
Mohammad Arafat
Tahlil Plus independently records and evaluates public market predictions. Extraction may be AI-assisted and results follow the Tahlil Plus methodology. This information is not financial advice.