
Love y’all ️ My links below ⬇️
3 extracted signals · 2 resolved · 1 still active
 Pip Snipers21 Dec 2025, 10:24 UTC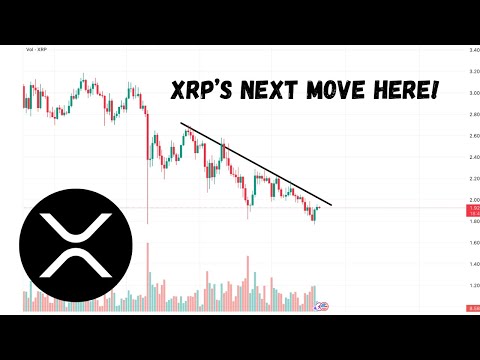
AI-generated source summary
The analysis focuses on XRP's price action from October 2023, observing a sustained downtrend mirroring Bitcoin's movements. Technical patterns such as a selling climax, automatic rally, secondary test of lows, and failed breaks indicate market dynamics influenced by algorithmic trading. XRP has notably lost momentum against Bitcoin during periods of consolidation. The daily Relative Strength Index (RSI) for XRP displays a triple bottom, suggesting potential for a bullish reversal. A key observation highlights a 'capitulation wick' on November 21st, coinciding with a double bottom on the XRP/USD Coinbase pair. The analysis posits that if XRP maintains a price above $1.8546 on the daily chart, it is likely to initiate a rally, potentially targeting previous highs around $2.70. Conversely, a drop below $1.8546 would invalidate this bullish outlook, indicating a further decline towards $1.54. For Bitcoin, two scenarios are presented: an upward movement towards its 50-week or 200-day moving average (approximately $100,000) or a sweep of the April lows around $75,000. USDT dominance analysis, showing a base formation and an inverted head and shoulders pattern, suggests a potential retest of lower levels before a push towards 8.58%. The strategic use of Fibonacci retracements and extensions aids in identifying critical price levels and potential targets for both assets. The overall sentiment suggests a near-term bullish opportunity for XRP, provided key technical supports are maintained, within a broader market context that anticipates a bearish phase in 2026.
AI-generated summary based on the source content.
Evidence and evaluation progress
- Original source published
The analyst published the original source item.
- First prediction resolved
The first evaluable outcome in this case reached a terminal result.
- Source recorded by Tahlil Plus
The public source was preserved as the evidence record for this case.
- Market predictions extracted
3 eligible signals linked to this case.
- Outcome tracking started
Tahlil Plus began monitoring the extracted predictions.
- Live evaluation in progress
1 signal remains active.
Signals in this source



More Prediction Case Files from Pip Snipers
XRP Price Analysis Today | Why I'm Waiting For $0.75 | 31 July 2026
The Two Paths for $ETH 🤫🤯
$ETH Price Analysis Today | Bullish Range July 29th
$BTC Price Analysis Today | Sweep Breakdown July 28th
XRP RETRACE IN THE WORKS 😯📈
XRP BOUNCE INCOMING! 🚀- Ripple XRP Top Down Technical Analysis 🧐
Pip Snipers
Tahlil Plus independently records and evaluates public market predictions. Extraction may be AI-assisted and results follow the Tahlil Plus methodology. This information is not financial advice.