
Welcome to Czar Gets Crypto! Please note the following:
1 extracted signal · 1 resolved · 0 still active
 C-Zar Gets Crypto 13 Dec 2025, 21:54 UTC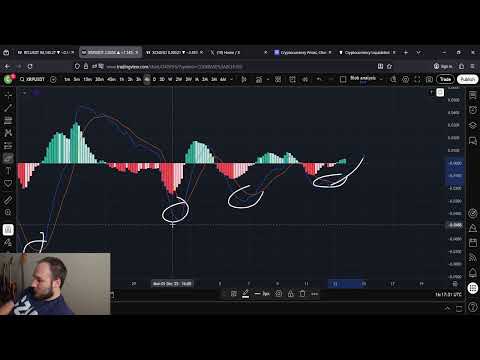
AI-generated source summary
The analysis focuses on XRPUSDT, currently trading at approximately $2.00. The presenter notes a recent 'fake out' low at $1.97, followed by a swift recovery, indicating underlying support. On the 1-hour timeframe, the Relative Strength Index (RSI) is predominantly above the 50-level, suggesting a bullish bias despite a horizontal resistance line. The Stochastic RSI on the 1-hour chart is positioned around the 50-mark, considered an ideal area for a bounce. The Moving Average Convergence Divergence (MACD) on the 1-hour chart, while showing positive momentum, is described as choppy, potentially limiting its immediate significance. Transitioning to the 4-hour timeframe, hidden bearish divergence is identified between the RSI's higher highs and the price's lower highs, potentially indicating a short-term downward correction. However, the presenter emphasizes that any such downward movement is unlikely to breach the flash crash low around $1.85, stating an 80% confidence against breaking this level. The 4-hour MACD exhibits bullish divergence, with oscillators forming higher lows and attempting to cross the zero threshold, signaling building upward momentum. On the daily timeframe, the RSI shows a distinct consolidation pattern, differing from previous clear rejections, hinting at an impending change in trend. The Stochastic RSI is bouncing from the oversold region, reinforcing bullish sentiment. The daily MACD is consistently building bullish momentum, with the blue line respecting and bouncing off the orange line, suggesting a strong upward move is imminent. The overall prediction is a significant breakout from the current year-long range, targeting initial resistance between $2.50 and $2.70, with a Fibonacci extension at $2.74. The ultimate long-term target is projected between $13.00 and $16.00 in Q1 of the following year. The breakout is anticipated to be rapid and decisive, akin to a 'shooting up' action, rather than a gradual ascent. The analysis sets a crucial invalidation point at $1.85; should the price drop below this level, the bullish thesis would be reconsidered, though any dip below this is expected to be short-lived.
AI-generated summary based on the source content.
Evidence and evaluation progress
- Original source published
The analyst published the original source item.
- First prediction resolved
The first evaluable outcome in this case reached a terminal result.
- Case evaluation completed
All evaluable predictions in this case reached terminal outcomes.
- Source recorded by Tahlil Plus
The public source was preserved as the evidence record for this case.
- Market predictions extracted
1 eligible signal linked to this case.
- Outcome tracking started
Tahlil Plus began monitoring the extracted predictions.
Signals in this source

More Prediction Case Files from C-Zar Gets Crypto
Bitcoin BTC Price Prediction: 31st of July
BCH Bitcoin Cash Price Prediction: 30th of July
BTC Bitcoin Price Prediction: 30th of July (Standard Volatility)
KTA Keeta Price Prediction: TIME TO BUY?!?!?!
XRP Price Prediction: 29th of July
Bitcoin BTC Price Prediction: 29th of July FOMC Meeting Today
C-Zar Gets Crypto
Tahlil Plus independently records and evaluates public market predictions. Extraction may be AI-assisted and results follow the Tahlil Plus methodology. This information is not financial advice.