
Our daily NVIDIA analysis breaks down critical levels, market trends, and insights for today’s trading session.
1 extracted signal · 1 resolved · 0 still active
 Wicked Stocks03 Dec 2025, 03:09 UTC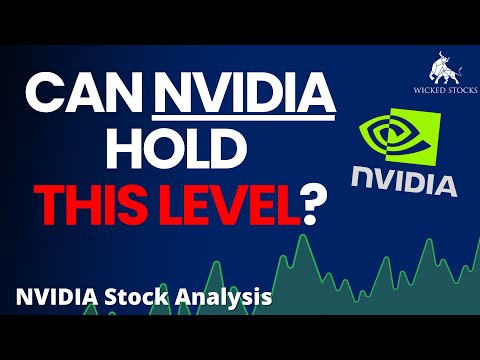
AI-generated source summary
The analysis focuses on NVIDIA (NVDA), presenting a bearish outlook based on technical chart patterns. On the weekly chart, a sell signal is triggered below 190.09, with rallies into the low 190s considered sell opportunities. A bearish rotation is anticipated following a test of the low 190s, leading back to the low 160s. The target price is 162.15 within the next 3-5 days. The daily chart shows a descending channel top resistance at 194.95. Support is at 174.13, but a close below this level would signal a further downside to 162.72 or even 158.86. The analysis is based on the anticipation of NVDA selling in the low 190's and buying in the low 160's.
AI-generated summary based on the source content.
Evidence and evaluation progress
- Original source published
The analyst published the original source item.
- First prediction resolved
The first evaluable outcome in this case reached a terminal result.
- Case evaluation completed
All evaluable predictions in this case reached terminal outcomes.
- Source recorded by Tahlil Plus
The public source was preserved as the evidence record for this case.
- Market predictions extracted
1 eligible signal linked to this case.
- Outcome tracking started
Tahlil Plus began monitoring the extracted predictions.
Signals in this source

More Prediction Case Files from Wicked Stocks
Tesla Stock Price Analysis | Top $TSLA Levels To Watch for July 31st, 2026
#TSLA MAY BOUNCE FIRST... THEN FALL TO $227 #Tesla #daytrading
Tesla Stock Price Analysis | Top $TSLA Levels To Watch for July 30th, 2026
#TSLA BOUNCED FROM $300... BUT IS IT A TRAP? #Tesla #daytrading
Tesla Stock Price Analysis | Top $TSLA Levels To Watch for July 29th, 2026
#TSLA $300 TEST IS ALMOST HERE #Tesla #daytrading
Wicked Stocks
Tahlil Plus independently records and evaluates public market predictions. Extraction may be AI-assisted and results follow the Tahlil Plus methodology. This information is not financial advice.