
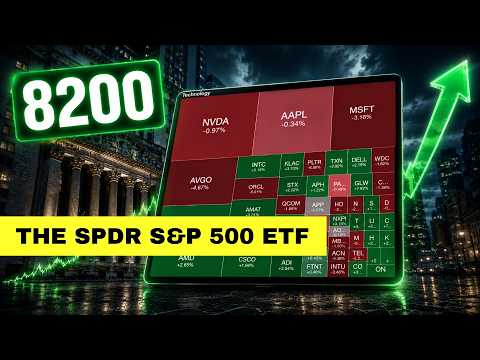
SPY ETF: Is SPY Headed to S&P 500 8200? 5 Price Scenarios + Tuesday Predicted Opening Price 📈
1 extracted signal · 0 resolved · 1 still active
 StockInvest.usIndependent analyst profile
- Source published
- 23 Jun 2026, 07:57 UTC
- Recorded by Tahlil Plus
- 23 Jun 2026, 08:13 UTC
AI-generated source summary
The SPDR S&P 500 ETF (SPY) is showing multiple short-term buy signals, coupled with a generally positive trend. Technical analysis indicates the current price level may present a buying opportunity for short-term outperformance. The ETF's short-term moving average is above the long-term moving average, signaling a bullish trend. A break above the short-term average would signal a buy, while a break below the long-term average would signal a sell. The ETF experienced a sell signal from a pivot top 13 days ago, with a 2% drop. Further declines are anticipated until a new bottom pivot is established. A sell signal from the 3-month Moving Average Convergence Divergence (MACD) has reduced overall risk, as volume is expected to follow price movements. The ETF's weekly volatility is 0.90%, and its risk is categorized as 'Very Low.' Resistance is at $746.52, support at $655.38. The ETF is currently testing support, with a predicted downside target of $655.38 and a potential upside target of $800.00. Breaking below support at $655.38 would invalidate the bullish short-term outlook. Trading at $744.39, the ETF has experienced a daily range of $743.13 to $750.18 and an open/close of $747.70/$744.39. Over the past 52 weeks, the ETF has traded between $591.89 and $760.40.
AI-generated summary based on the source content.
Signal outcomes at a glance
Tracking LiveSignals in this source

Evidence and evaluation progress
- Original source published
The analyst published the original source item.
- Source recorded by Tahlil Plus
The public source was preserved as the evidence record for this case.
- Market predictions extracted
1 eligible signal linked to this case.
- Source processing completed
Source analysis and structured extraction completed.
- Outcome tracking started
Tahlil Plus began monitoring the extracted predictions.
- Live evaluation in progress
1 signal remains active.
StockInvest.us
Platform-wide history, separate from this source evaluation.
Tahlil Plus independently records and evaluates public market predictions. Extraction may be AI-assisted and results follow the Tahlil Plus methodology. This information is not financial advice.