
Using Technical Analysis, we analyzed Applied Digital (APLD) stock and predicted where price would go within the next few days to weeks.
1 extracted signal · 1 resolved · 0 still active
 IC Trades02 Aug 2025, 02:04 UTC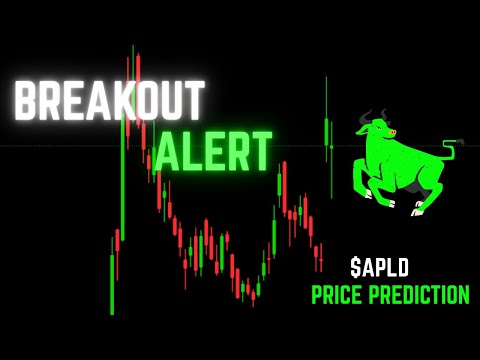
AI-generated source summary
APLD stock has broken through resistance at the 11.08 level, experiencing a gap up due to announcing data center deals. It faces resistance around $13.20. The daily chart shows sellers pushing down, but buyers are supporting at past resistance. The analysis anticipates buyers continuing upwards to $15.42, but a drop back into the pennant range below $11.08 is also a possibility. The weekly chart showed $14.20 being tested with investors reacting positively to a $7 billion deal with NVIDIA. A descending channel from $3.30 led to an all-time high of $15.42, indicating volatility. Currently around $12.52. On the hourly chart, support formed around $9.02 previously. Reaching $14.05 would improve bullish outlook.
AI-generated summary based on the source content.
Evidence and evaluation progress
- Original source published
The analyst published the original source item.
- First prediction resolved
The first evaluable outcome in this case reached a terminal result.
- Case evaluation completed
All evaluable predictions in this case reached terminal outcomes.
- Source recorded by Tahlil Plus
The public source was preserved as the evidence record for this case.
- Market predictions extracted
1 eligible signal linked to this case.
- Outcome tracking started
Tahlil Plus began monitoring the extracted predictions.
Signals in this source

More Prediction Case Files from IC Trades
IREN's Breakout Surge Triggered? | IREN Stock Analysis
APLD's (Applied Digital) Bounce Move Nearby? | APLD Stock Analysis
ONDS Ready For a Major BREAKOUT Movement? | ONDS Stock Analysis
NIO's Next BIG Move? | NIO Stock Analysis
SOFI Huge Earnings Breakout Ahead? | SOFI Stock Analysis
SMCI Massive Revival Breakout? | SMCI Stock Analysis
IC Trades
Tahlil Plus independently records and evaluates public market predictions. Extraction may be AI-assisted and results follow the Tahlil Plus methodology. This information is not financial advice.